Analysis software
A wide range of options are available for data analysis.
The analysis software calculates the product parameters from the measured colored 3D point cloud. This data are processed, stored, and visualized via a web application running on the integrated PC. You can access this data via web browser from anywhere inside your organization.
The analysis software supports
- System setup
- Training, production, and calibration modes
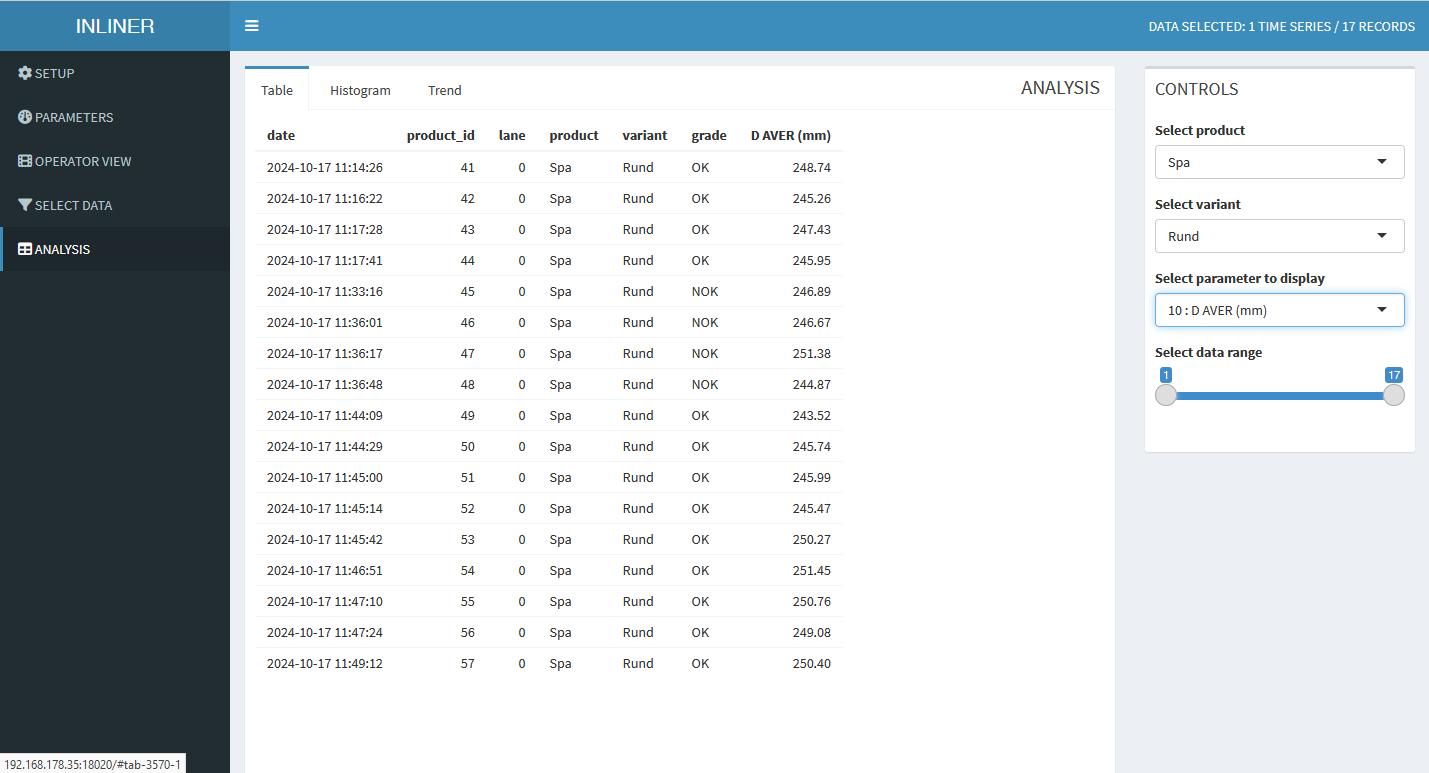
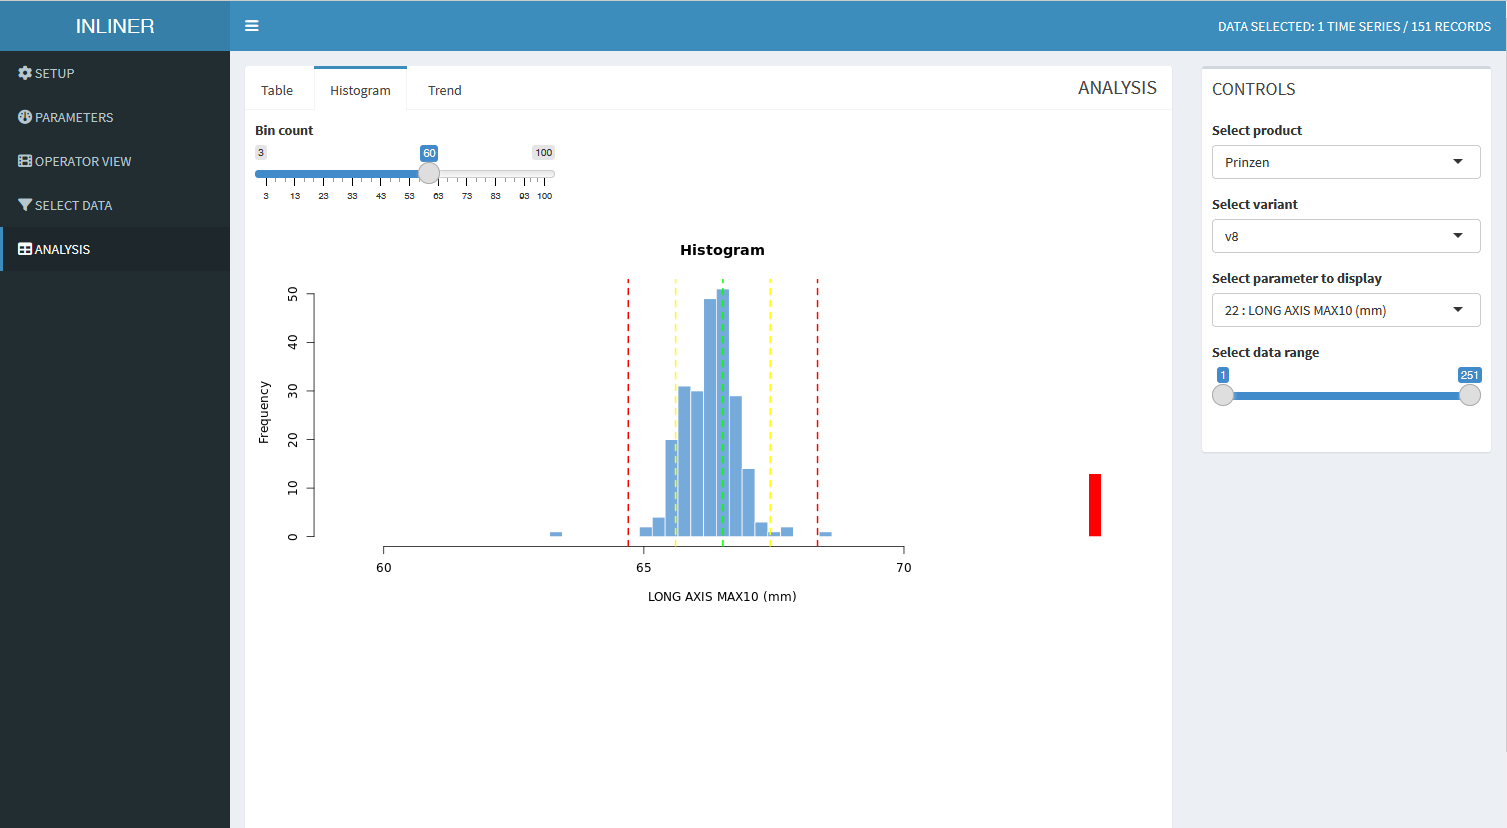
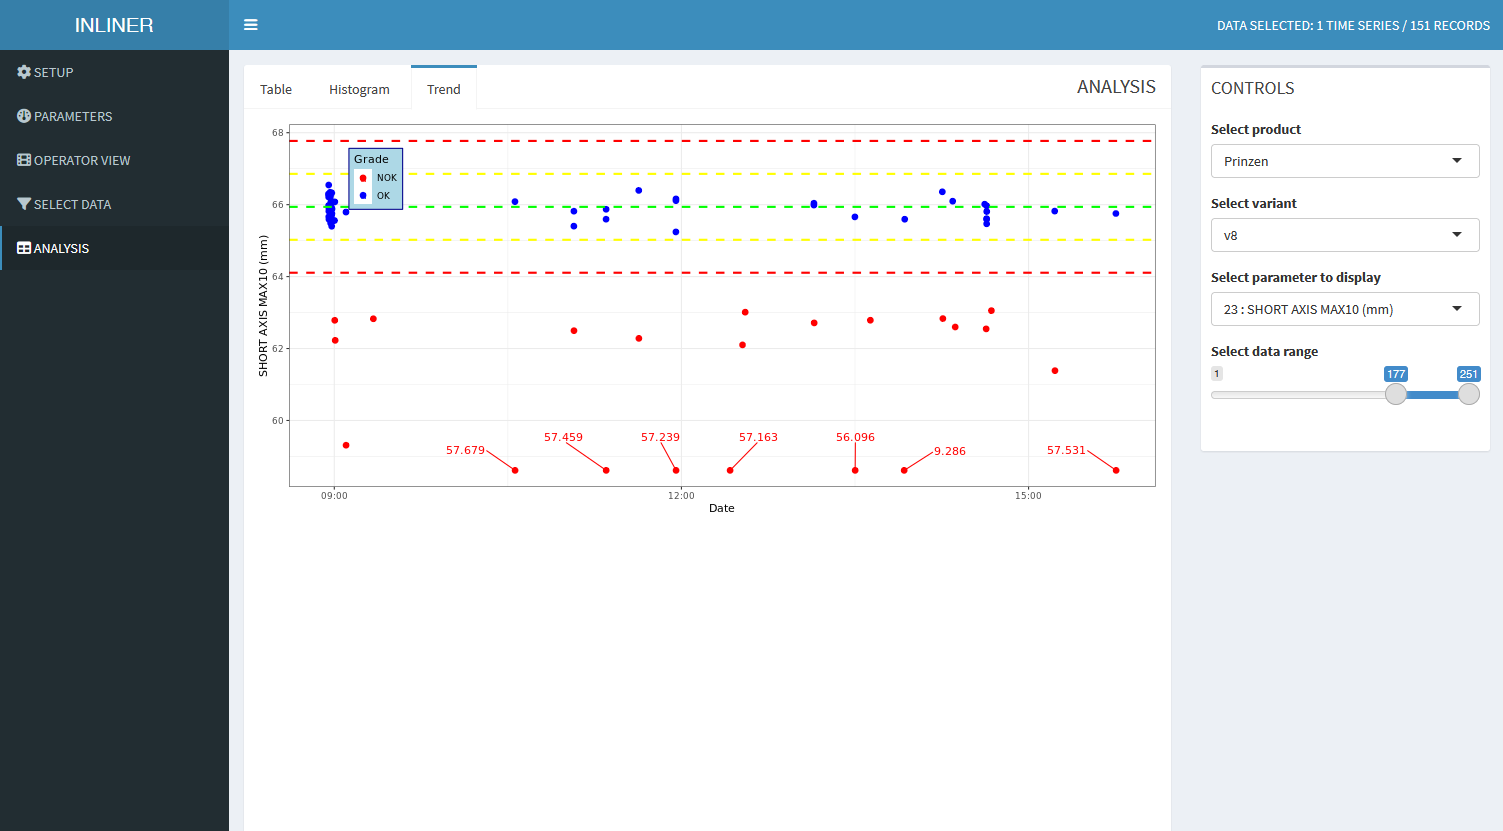
- Data visualization via table, histogram, and trend plot view
- Automatic calculation and manual adjustment of process limits
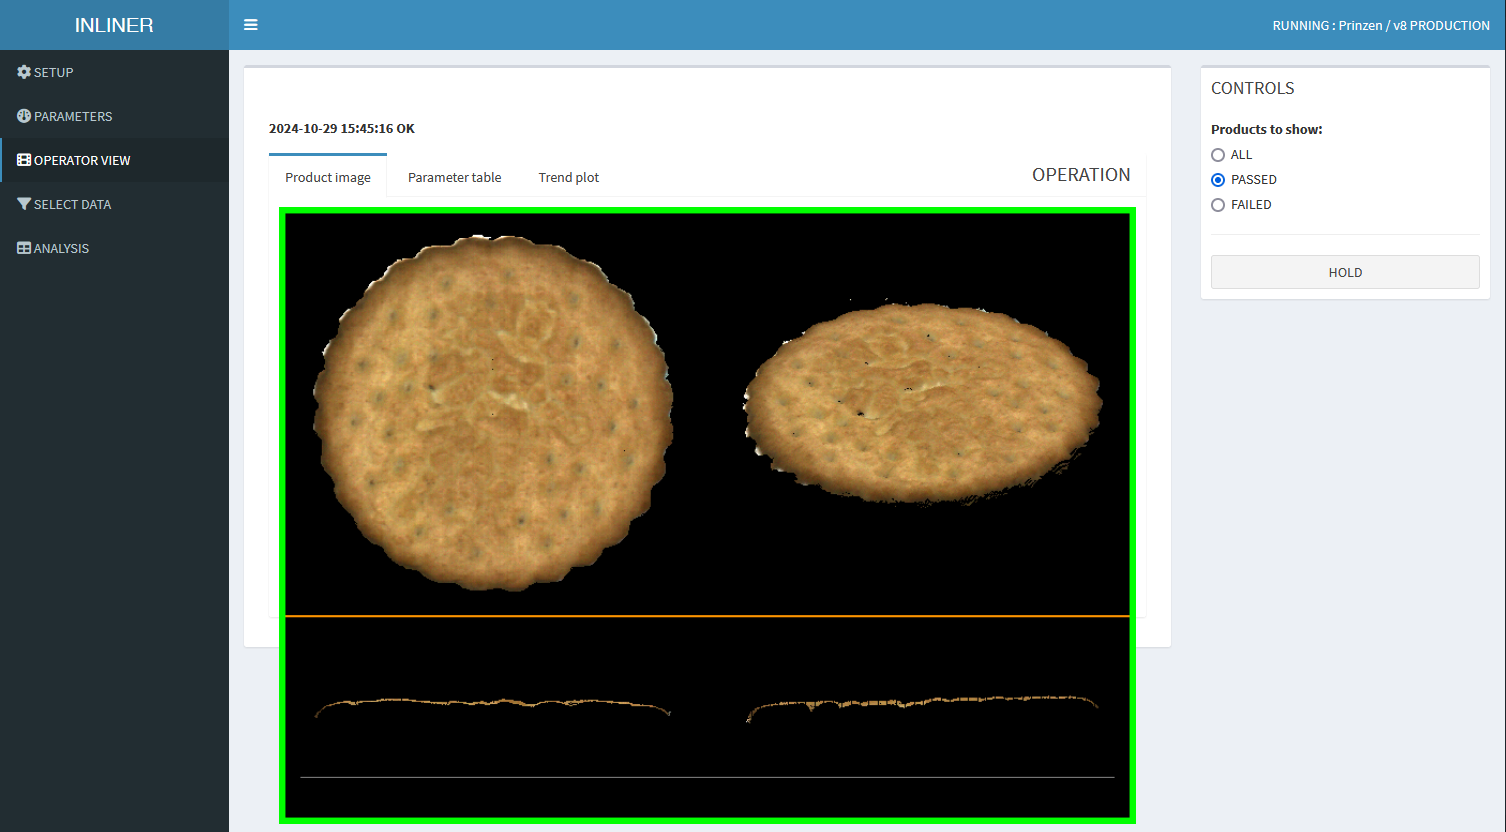
- Real time product visualization in 3-side view
The software is constantly being further developed to meet the requirements of our customers.
Click on the screenshots to view them in an enlarged format.
Setup
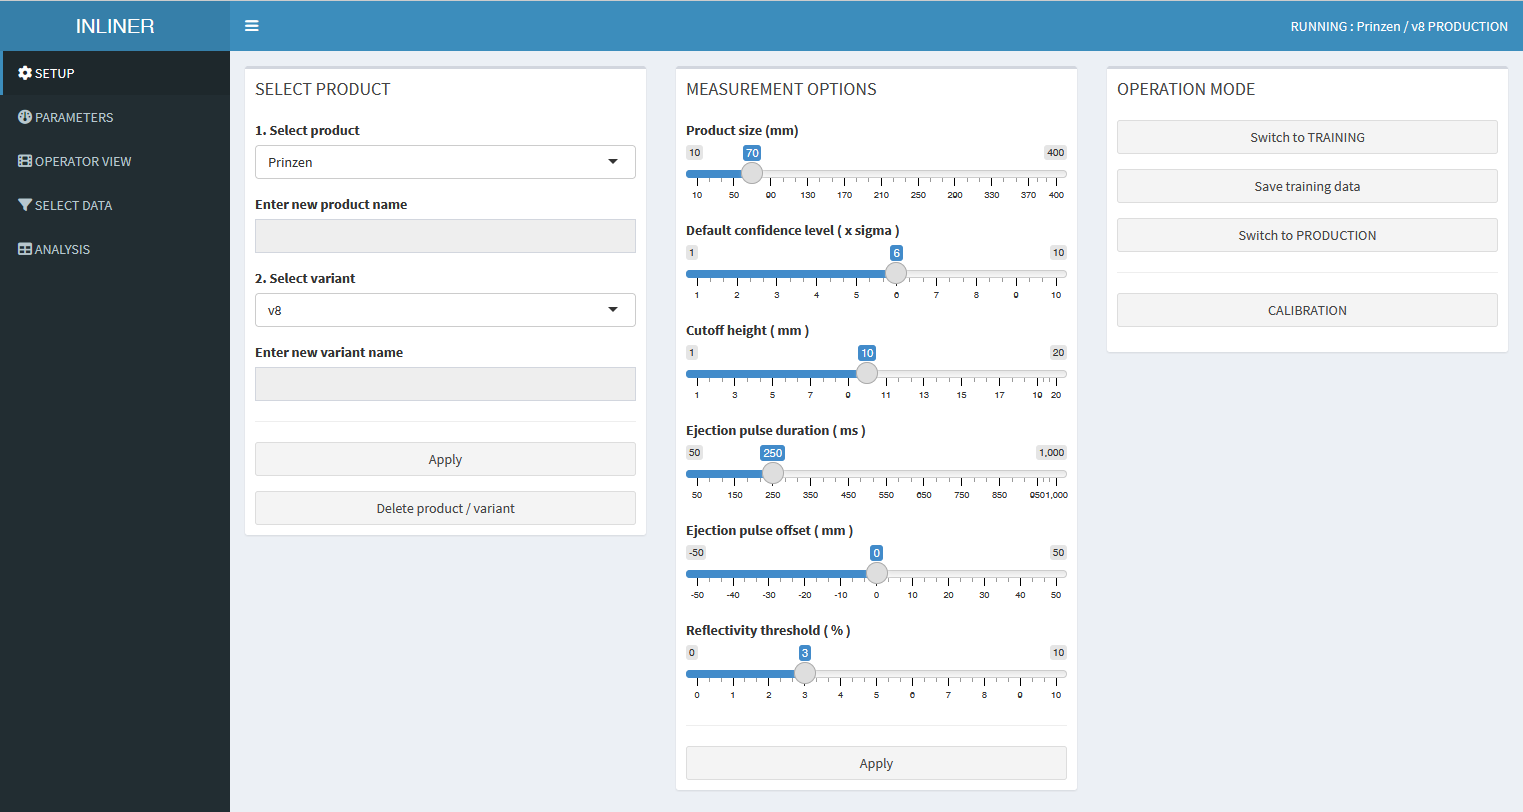
Process window

Data selection

Table view
Histogram view
Trend diagram
Operator view Product OK
Operator view Product not NOK

Operator view parameter table